Splunk Integration with Device42
Integrations
- Ansible
- Chef
- Cherwell
- Confluence
- CyberArk
- Foreman
- Foreman Smart Proxy
- Freshservice
- HPSM
- Infoblox
- Jenkins
- Jira
- Jira Cloud
- Jira Service Management Cloud
- Logstash
- Microsoft LAPS
- Microsoft SCCM
- OpsGenie
- PagerDuty
- PowerBI
- Puppet
- Rundeck
- SaltStack
- Samanage
- ServiceNow
- ServiceNow Express
- Splunk
- StackStorm
- VMWare VRealize
- Zapier
- Zendesk
Device42’s audit data can prove more useful if viewed in the same context as other events from around your network, like change logs and triggers from received from other monitoring, logging, and/or security tools.
With the Device42 / Splunk integration, you’ll be able to view your Device42 SIEM audit data in the same context as other changes from around your network, easily correlating events and triggers from other monitoring, logging, and/or security tools no matter where they occurred.
Send Device42 logs to Splunk for better event correlation!
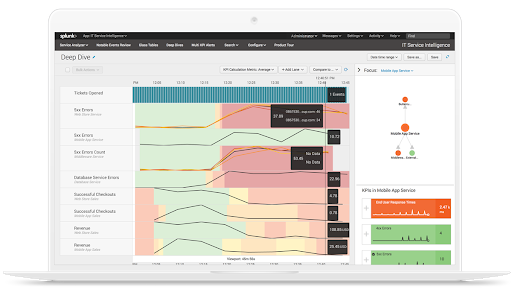
When you ship your logs to Splunk, you can visually audit logs and event flow, and can take advantage of a wealth of built-in visualizations.
You’ll also benefit from better event correlation when you send logs to Splunk since all your logs are now visible in the same, searchable place.Correlating events around your infrastructure has never been easier!


See log data in both applications!
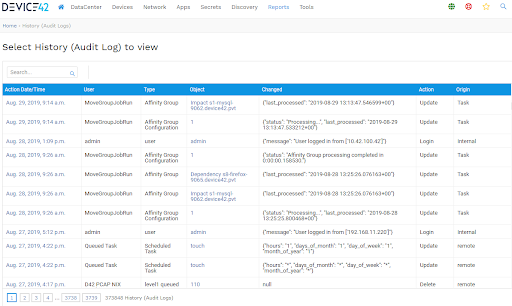
Once you’ve configured your logs to ship to Splunk, continue to use Device42 as usual. You’ll still be able to view your logs from within the Device42 UI just like you always have!
There’s no complex learning curve after configuring Device42 to send logs to Splunk. Simply begin leveraging the power of external SIEM — without disrupting familiar workflows!
Send Device42 Logs to Splunk in Real-time with Webhooks
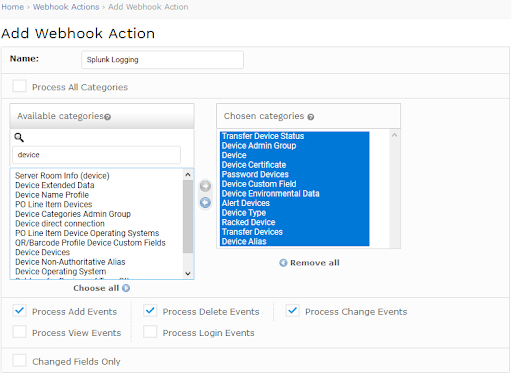
Getting your Device42 logs to Splunk is easy. Head over to Tools → Webhooks → Actions, and simply configure one or more webhooks to push events!
We recommend using Splunk’s http event collector with webhooks. Learn more about configuring the http event collector in Splunk’s document, and get more details in our SIEM/External Logging documentation.
- A Splunk installation with the HTTP Event Collector (HEC) enabled. This is not enabled by default. Full details on enabling can be found on this page on Splunk’s dev site.
- Once the HEC plugin is enabled, simply configure a webhook endpoint that points to your Splunk instance.
- Configure your desired webhook actions.
- That’s it! Save your settings, and start seeing Device42 Audit Data flow into Splunk!

Start correlating Device42 audit logs with infrastructure event data today!
If you aren’t already a Device42 user, download a free 30-day trial NOW!
For documentation on setting up the integration, see our documentation here.